| A Share: DPIAX | I Share: DPIIX | C Share: DPICX |
Destra Flaherty & Crumrine Preferred and Income Fund
10 years of delivering income by investing in preferred securities.
DPIIX As of 3/31/21
| Annualized Returns | |
|---|---|
| 1-Year | 25.17% |
| 3-Year | 6.50% |
| 5-Year | 6.87% |
| 7-Year | 6.80% |
| Since Inception (4/12/11) | 7.37% |
Data presented reflects past performance, which is no guarantee of future results. Investment results and principal value will fluctuate so that shares, when redeemed, may be worth more or less than their original cost. Due to market volatility, current performance may be higher or lower than the performance shown. Call 877.855.3434 or access our website at destracapital.com for performance current to the most recent month end. Performance shown for Class A Shares with load includes the Fund’s maximum sales charge of 4.50%. Returns for period of less than one year are not annualized, and include reinvestment of all distributions. The Fund’s Gross/Net Expense ratios are as follows: I Shares 1.22%.
Reasons to Consider the Preferred and Income Fund
1. Preferreds offer investors attractive yields when compared to other fixed-income asset classes
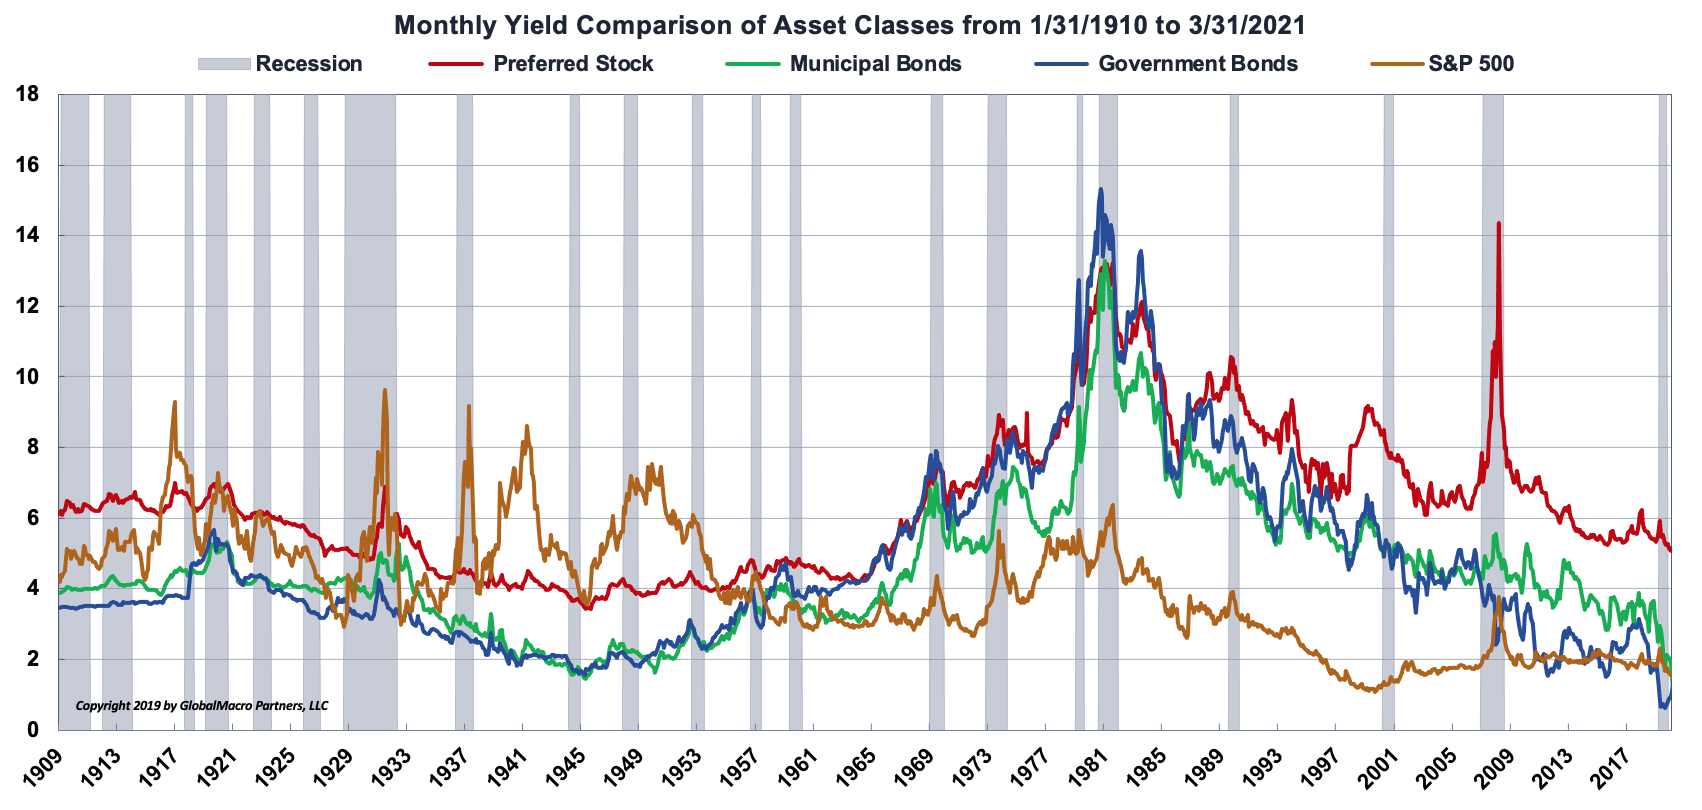
Source: NBER; FRED, Federal Reserve Bank of St. Louis; Standard & Poor’s; US BEA Survey of Current Business; Morningstar; Flaherty and Crumrine; and GlobalMacro Partners, LLC
Definitions Recession Recession Dates measured by NBER Preferred Stock Preferred Stock Yields Municipal Bonds High Quality Municipal Bond Yields Government Bonds 10 YR Treasury Yields S&P 500 S&P 500 Dividend Yields All information is historical and for illustrative purposes only Past performance does not guarantee future results
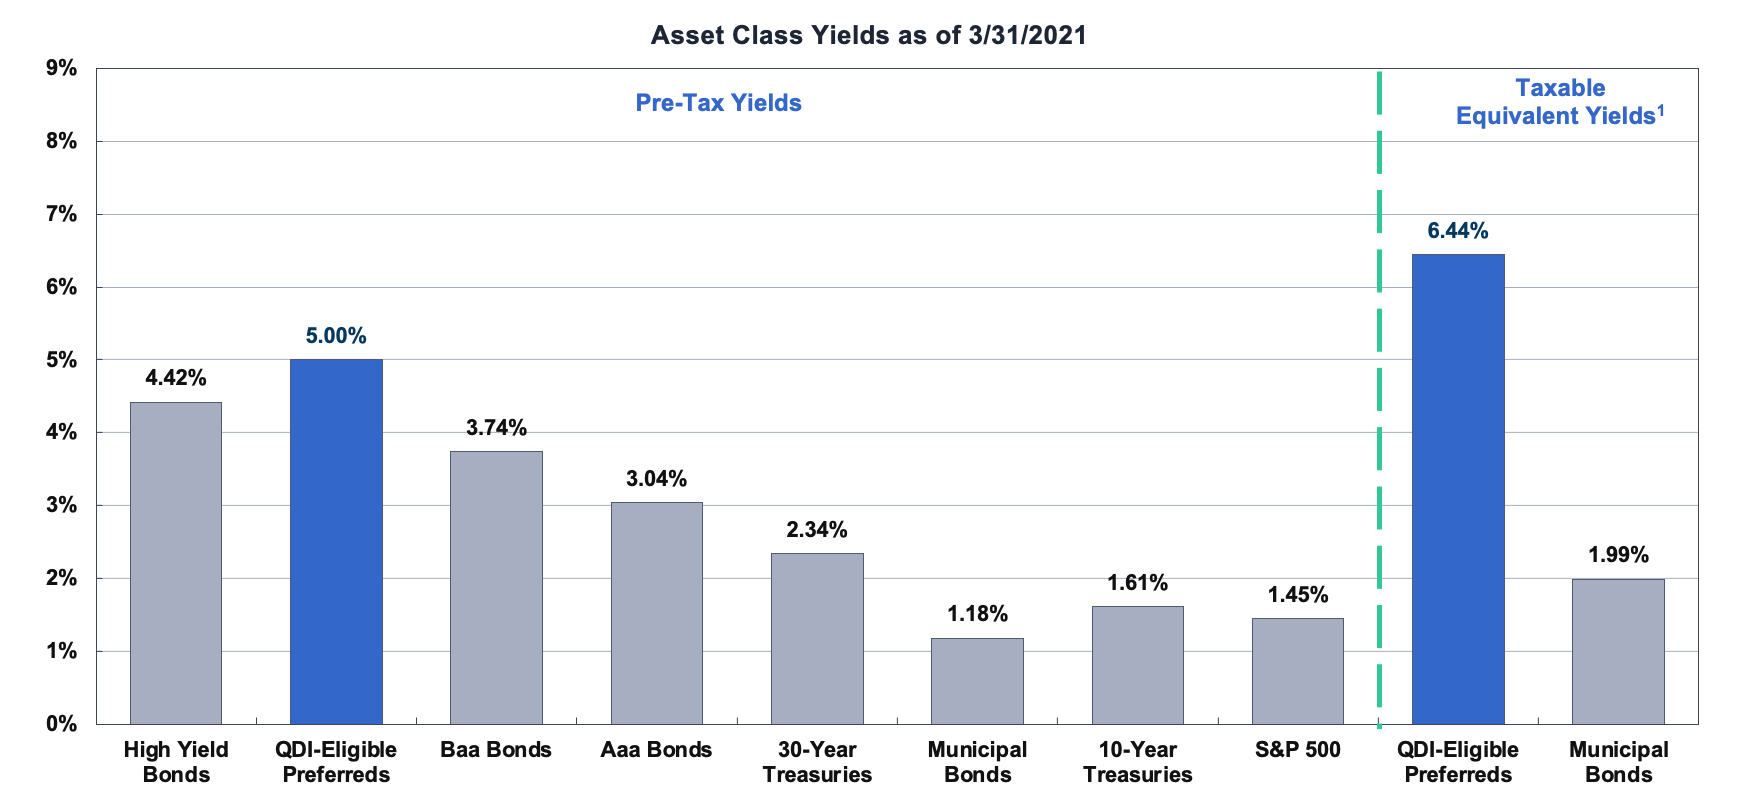
2. Preferred stocks also offer potential tax advantages, with high current income before and after tax.
Source
Flaherty Crumrine, Bloomberg, Barclays Live, S&P, FRED
1 Assumes a marginal income tax rate of 37% a 3.8% Medicare surtax on investment income and a QDI rate of 20% See the glossary page of this presentation for a definition of QDI
Index Definitions High Yield Bonds ICE BofA ML U S HY Master II Yield Index Baa Bonds QDI Eligible Preferreds Flaherty Crumrine proprietary database Moody’s U S Baa Corporate Bond Index Aaa Bonds Moody’s U S Aaa Corporate Bond Index 30 Year Treasuries 30 Year U S Treasury CM Municipal Bonds Bloomberg Barclays Municipal Bond Index 10 Year US Treasury 10 Year U S Treasury CM S&P 500 Index All information is historical and for illustrative purposes only Past performance does not guarantee future results
3. Preferred stocks offer diversification benefits via low correlations
to other asset classes
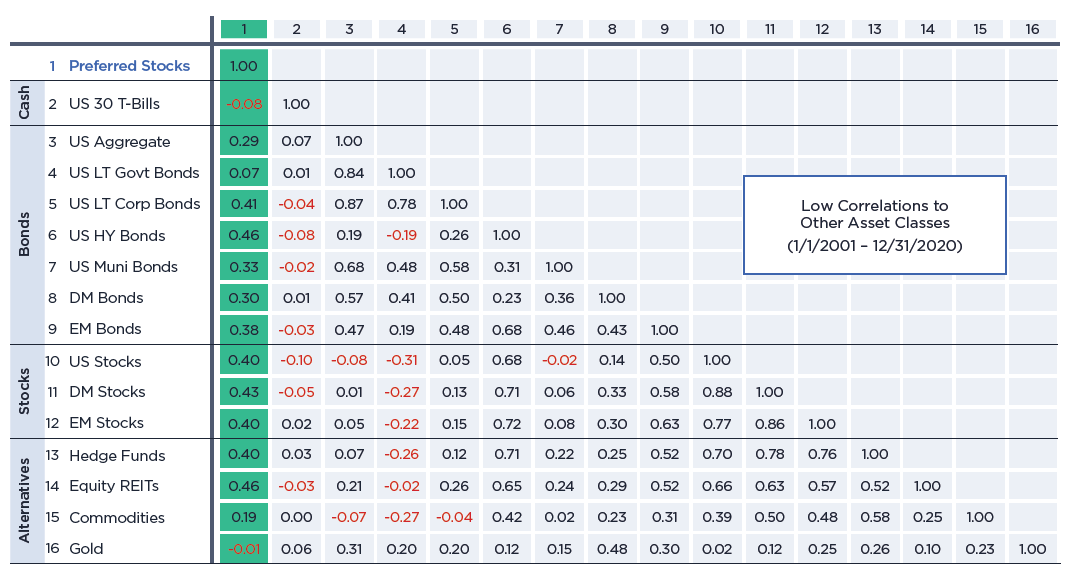
Source: Morningstar and GlobalMacro Partners, LLC.
Index Definitions: Preferred Stocks ICE BofAML Fixed Rate Preferred TR US Stocks S&P 500 TR EM Bonds JPM EMBI Plus TR DM Bonds FTSE Citi WGBI non USD TR Muni Bonds Bloomberg Barclays Muni TR US LT Govt Bonds IA SBBI LT Government TR US Sr Loans Credit Suisse Leveraged Loan TR US TIP ICE BofAML US Inflation Linked TR US HY Bonds IA Barclays High Yield Corp TR US Corp IA SBBI LT Corporate TR US Agg Barclays US Aggregate Bond TR US T Bills IA SBBI T Bill TR DM Stocks MSCI EAFE TR EM Stocks MSCI EM TR REITs FTSE NAREIT All Equity TR Gold London PM Spot Gold Commodities S&P GSCI TR Hedge Credit Suisse Hedge Fund Index. All information is historical and for illustrative purposes only. Past performance does not guarantee future results.
4. Preferreds offer Historically Strong Performance During Periods of Rising Rates
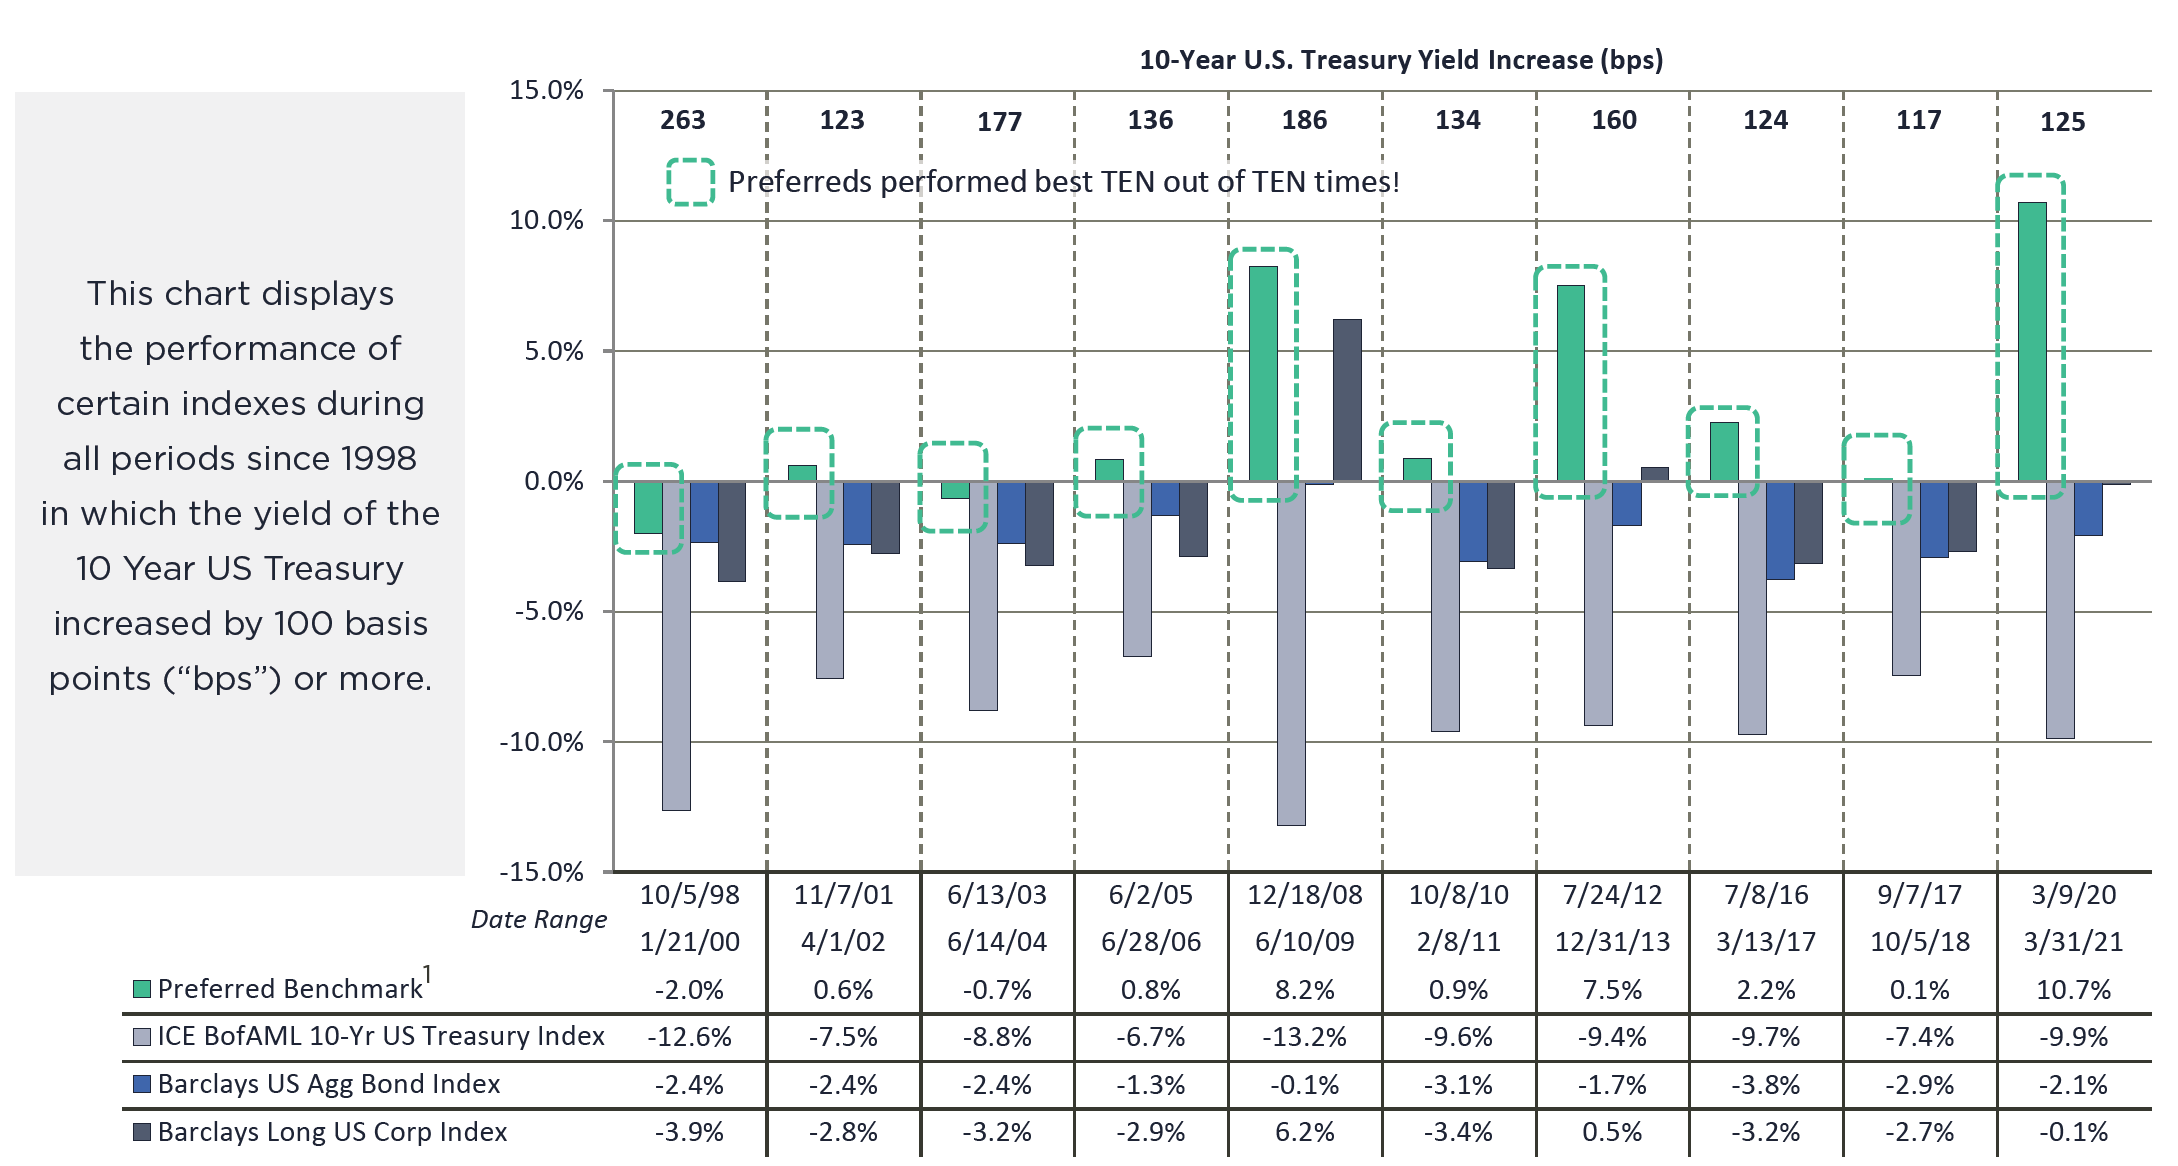
Source: Treasury.gov, Morningstar, Barclays and Bloomberg
Table surveys daily data. Indexes are unmanaged, do not reflect the deduction of fees or expenses and are not available for direct investment. Past performance is not indicative of future results. Index performance is for illustrative purposes only
1 The Preferred Benchmark consists of the ICE BofAML Fixed Rate Preferred Securities Index (P0P1) for time periods prior to 3/31/2012, and thereafter the ICE BofAML 8% Constrained Core West Preferred & Jr Subordinated Securities Index (P8JC). The benchmarks from ICE Data Indices, LLC (“ICE Data”) are used with permission. ICE Data, its affiliates and their respective third party suppliers disclaim any and all warranties and representations, express and/or implied, including any warranties of merchantability or fitness for a particular purpose or use, including the indices, index data and any data included in, related to, or derived therefrom. Neither ICE Data, its affiliates nor their respective third party providers shall be subject to any damages or liability with respect to the adequacy, accuracy, timeliness or completeness of the indices or the index data or any component thereof, and the indices and index data and all components thereof are provided on an “as is” basis and your use is at your own risk. ICE Data, its affiliates and their respective third party suppliers do not sponsor, endorse, or recommend Flaherty & Crumrine Incorporated, or any of its products or services.
2 Daily time series not available. Prior to 4/27/2000, only monthly returns are available on the Barclays Long US Corp Index