Destra Flaherty & Crumrine Preferred and Income Fund
A Shares
- Ticker: DPIAX
- CUSIP: 25064T106
I Shares
- Ticker: DPIIX
- CUSIP: 25064T403
T Shares
- Ticker: DPICS
- CUSIP: 25064T205
Portfolio Managers
Flaherty & Crumrine IncorporatedFlaherty & Crumrine Incorporated is the veteran, dedicated preferred securities manager. Independent, employee controlled adviser, founded in 1983, makes them one of the oldest and most experienced firm specializing in the management of preferred securities. Investment TeamR. Eric Chadwick Bradford S. Stone |

|
Investment Objective
To seek total return, with an emphasis on high current income.
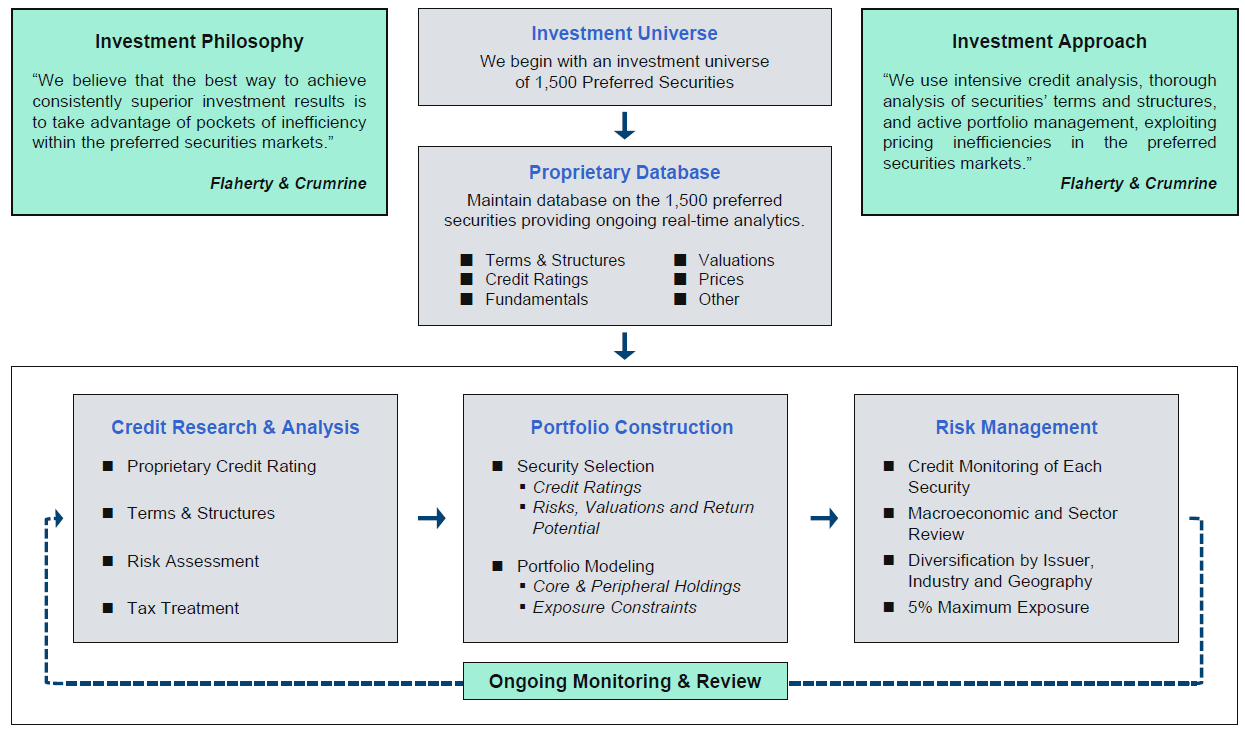
Investment Strategy and Philosophy
The Fund’s portfolio manager, Flaherty & Crumrine was founded in 1983, and is one of the of the oldest preferred securities managers in the industry. Through the years they have built a proprietary database on over 1500 separate issues of preferred securities. Flaherty & Crumrine then leverages their experience and data base seeking to unlock hidden value, in what they believe is an inefficient preferred securities market. To accomplish this goal the Fund will, in normal markets, invest at least 80% of it’s net assets in a portfolio of preferred and income producing securities. The securities in which the Fund may invest include traditional preferred stock, trust preferred securities, hybrid securities, convertible securities, contingent-capital securities, subordinated debt, and senior debt securities of other open-end, closed-end or exchange-traded funds that invest primarily in the same types of securities. The Fund may invest up to 15% of its assets in common stocks. In addition, under normal market conditions, the Fund invests more than 25% of its total assets in companies principally engaged in financial services.
The Fund will principally invest in (i) investment grade quality securities or (ii) below investment grade quality preferred or subordinated securities of companies with investment grade senior debt outstanding, in either case determined at the time of purchase. Securities that are rated below investment grade are commonly referred to as “high yield” or “junk bonds.” However, some of the Fund’s total assets may be invested in securities rated (or issued by companies rated) below investment grade at the time of purchase. Preferred and debt securities of below investment grade quality are regarded as having predominantly speculative characteristics with respect to capacity to pay dividends and interest and repayment of principal. Due to the risks involved in investing in preferred and debt securities of below investment grade quality, an investment in the Fund should be considered speculative. The maturities of preferred and debt securities in which the Fund will invest generally will be longer-term (perpetual, in the case of some preferred securities, and ten years or more for other preferred and debt securities); however, as a result of changing market conditions and interest rates, the Fund may also invest in shorter-term securities.
Investment Process
Flaherty & Crumrine analysts accumulate information on all available data points for each security. The data is developed into a proprietary, individual Security Master Report. Analysts and portfolio managers then model security risks and valuation, seeking to determine what they are getting paid to own a company’s subordinated capital. Based on current market conditions and opportunities the portfolio is assembled, managed and maintained.
Performance
Quarterly
as of 3/31/26
| ticker | 3 MO | YTD | 1YR | 3YR | 5 YR | from incep. |
distribution | |
|---|---|---|---|---|---|---|---|---|
| DPIAX1 | A at NAV | -0.93 | -0.93 | 5.90 | 9.13 | 2.72 | 5.58 | monthly |
| DPIAX | A | -5.38 | -5.38 | 1.13 | 7.47 | 1.78 | 5.25 | monthly |
| DPIIX | I | -0.94 | -0.94 | 6.12 | 9.38 | 2.96 | 5.88 | monthly |
| DPICX | C | -1.16 | -1.16 | 5.07 | 8.30 | 1.94 | 4.85 | monthly |
| Index* | -0.52 | -0.52 | 5.08 | 7.63 | 2.51 | 5.55 |
Monthly
as of 4/30/26
| ticker | 3 MO | YTD | 1YR | 3YR | 5 YR | from incep. |
distribution | |
|---|---|---|---|---|---|---|---|---|
| DPIAX1 | A at NAV | 0.50 | 1.13 | 9.06 | 9.58 | 2.90 | 5.69 | monthly |
| DPIAX | A | -4.00 | -3.41 | 4.15 | 7.90 | 1.96 | 5.37 | monthly |
| DPIIX | I | 0.51 | 1.15 | 9.31 | 9.83 | 3.16 | 5.99 | monthly |
| DPICX | C | 0.25 | 0.82 | 8.19 | 8.74 | 2.12 | 4.96 | monthly |
| Index* | 0.20 | 1.46 | 8.34 | 7.80 | 2.64 | 5.66 |
*Effective April 30, 2012, the Destra Flaherty & Crumrine Preferred and Income Fund (the “Fund”) adopted the ICE BofAML 8% Constrained Core West Preferred & Jr Subordinated Securities Index (“New Index”) as its primary benchmark. Previously, the Fund utilized a blend of 50% of the ICE BofAML Hybrid Preferred Securities 8% Constrained Index and 50% of the ICE BofAML US Capital Securities US Issuers 8% Constrained Index (“Former Index”) that was equally weighted average and rebalanced monthly. Going forward, the Fund’s performance will be compared to the New Index as we believe it more closely reflects the Fund’s investable universe. The utilization of the New Index will be reflected prospectively, therefore, all performance prior to April 30, 2012 will be compared to the Former Index.
1 At NAV
Class A shares performance reflects the deduction of the maximum sales charge of 4.50%
Included in the each Fund’s Class A shares expenses is a distribution and service (12b-1) fee of 0.25%.
Class C shares have a maximum contingent deferred sales charge (CDSC) of 1%. However, w/CDSC performance for Class C shares reflects the deduction of 1% for all shares redeemed within 12 months of purchase.
Included in the each Fund’s Class C shares expenses is a distribution and service (12b-1) fee of 1.00%.
A 2% redemption fee will be imposed on certain redemptions or exchanges out of the Class I shares of the Fund within 90 days of purchase. Exceptions to the redemption fee are listed in the Fund's prospectus.
Data presented reflects past performance, which is no guarantee of future results. Investment results and principal value will fluctuate so that shares, when redeemed, may be worth more or less than their original cost. Due to market volatility, current performance may be higher or lower than the performance shown. Performance shown for Class A Shares with load includes the Fund’s maximum sales charge of 4.50%. Returns for period of less than one year are not annualized, and include reinvestment of all distributions. The Fund’s Gross/Net Expense ratios are as follows: I Shares 1.26%/1.25%, A Shares 1.51%/1.50%, and C Shares 2.26%/2.25%.
The Adviser has agreed to cap expenses such that the total annual fund operating expenses, excluding brokerage commissions and other trading expenses, taxes, interest, acquired fund fees and other extraordinary expenses (such as litigation and other expenses not incurred in the ordinary course of business) do not exceed 1.25%, 1.50% and 2.25% of the Fund’s average daily net assets attributable to Class I, Class A and Class C shares, respectively. The arrangement will continue in effect until January 28, 2031, may be terminated or modified prior to that date only with the approval of the Fund’s Board of Trustees and will automatically continue in effect for successive twelve-month periods thereafter. Class A and C shares have a 12b-1 fee of up to 0.25% and distribution fee of up to 0.75% for Class C Shares. A contingent deferred sales charge of 1.00% applies on Class C shares redeemed within 12 months of purchase.
Yields
as of 3/31/26
| A Share | C Share | I Share | |
|---|---|---|---|
| 30-Day SEC Yield | 4.79% | 4.26% | 5.28% |
| 12-Month Distribution Yield | 5.27% | 4.47% | 5.55% |
30-day SEC yield is calculated by dividing the net investment income per share earned during the most recent 30-day period, by the maximum offering price per share on the last day of the period and includes the effects of fee waivers and expense reimbursements, if applicable.
12-month distribution yield is calculated by adding the fund’s trailing 12-month income distributions, and dividing the sum by the fund’s most recent month ended NAV.
Current Distribution
as of 4/30/26
| Ticker | Amount | Record Date | Ex-Date | Payable Date |
|---|---|---|---|---|
| DPIAX | 0.0899 | 4/28/26 | 4/29/26 | 4/30/26 |
| DPIIX | 0.0937 | 4/28/26 | 4/29/26 | 4/30/26 |
| DPICX | 0.0786 | 4/28/26 | 4/29/26 | 4/30/26 |
Click Here to see a complete listing of historical distributions.
Past performance is no guarantee of future results.
Portfolio Characteristics
Fund Basicsas of 3/31/26
List of Historical Qualified Dividend Income (QDI) for the Fund 1 A Qualified Dividend (QDI) is a dividend that falls under capital gains tax rates that are lower than the income tax rates on unqualified, or ordinary, dividends.This does not reflect year-end results or actual tax categorization of Fund distributions. These percentages can, and do, change, perhaps significantly, depending on market conditions. Investors should consult their tax advisor regarding their personal situation. 2 Current Yield: The annual income on an investment divided by the current price. It represents the expected annual yield at current prices if held for one year. The Current Yield is calculated on the portfolio level and doesn’t take into account any fees. Current Yield represents the yield of the portfolio on a specific day. Due to portfolio activity (fund redemptions and subscriptions, sales, purchases, calls), the actual income earned by the portfolio over the next year may be different from the current yield calculated on any particular day. 3 Yield-to-Worst: The lowest yield among Current Yield, Yield-to-Maturity and Yield-to-Call. It represents the lowest expected annual yield at current prices if held for one year, taking into account potential loss from call or maturity. 4 Effective Duration measures sensitivity to interest rates by indicating an approximate percentage change in the value of the Fund's portfolio given a 1% change in interest rates. Effective Duration is a duration calculation for bonds with embedded options. It takes into account the expected change in a security’s price caused by the embedded option as U.S. Treasury rates change, assuming the security’s option-adjusted spread to Treasuries remains constant. Duration can be measured differently by different analytics tools used by the Fund’s Investment Sub-Advisor. The duration measures presented here may differ from those used to manage the portfolio, or in other presentations describing the portfolio. Also, this duration measure may differ from that used by other funds/advisers or calculation agents, so reported durations of other funds or investment products may not be directly comparable. Source: Flaherty & Crumrine, Inc. Credit Qualityas of 3/31/26
Credit Ratings, as rated by S&P and Moody’s, is an assessment of the credit worthiness of an issuer of a security. AAA is the highest rating, the obligor’s capacity to meet its financial commitments is strong. As ratings decrease, the obligor is considered more speculative by market participants. Credit ratings apply only to the bonds and preferred securities in the portfolio and not to the shares of the fund which will fluctuate in value. |
Listing Typeas of 3/31/26
Maturity Scheduleas of 3/31/26
Call Riskas of 3/31/26
|
||||||||||||||||||||||||||||||||||||||||||||||||||||||||||||||||||||||||||||||||||||||||||||
Sector Breakdownas of 3/31/26 |
|
||||||||||||||||||||||||||||||||||||||||||||||||||||||||||||||||||||||||||||||||||||||||||||
Geographic Breakdownas of 3/31/26 |
|
||||||||||||||||||||||||||||||||||||||||||||||||||||||||||||||||||||||||||||||||||||||||||||
Security Typesas of 3/31/26 |
|
||||||||||||||||||||||||||||||||||||||||||||||||||||||||||||||||||||||||||||||||||||||||||||
Coupon Typesas of 3/31/26 Top 10 Holdings (% of total assets)as of 3/31/26
Holdings are subject to change without notice. There is no assurance that the investment process will lead to successful investing. All compositions are subject to daily changes with market actions. |
|
||||||||||||||||||||||||||||||||||||||||||||||||||||||||||||||||||||||||||||||||||||||||||||
Literature
Marketing Materials
Regulatory Documents
- Annual Financial Statements and Other Information (pdf)
- Class A Share Annual Report (pdf)
- Class A Share Semi-Annual Report (pdf)
- Class C Share Annual Report (pdf)
- Class C Share Semi-Annual Report (pdf)
- Class I Share Annual Report (pdf)
- Class I Share Semi-Annual Report (pdf)
- Destra Funds Audit Committee Charter (pdf)
- Destra Funds Cap Gains Estimates (pdf)
- Form N-PX (pdf)
- Nominating and Governance Committee Charter (pdf)
- Proxy Voting Policy (pdf)
- Semi-Annual Financial Statements and Other Information (pdf)
- Statement of Additional Information (pdf)
- Summary Prospectus (pdf)
- Summary Prospectus XBRL File (zip)
Fund Forms
News
Glossary
BofA Merrill Lynch 8% Constrained Core West Preferred & Jr Subordinated Securities Index tracks the performance of US dollar denominated high grade and high yield preferred securities and deeply subordinated corporate debt issued in the US domestic market. Qualifying securities must be rated at least B3, based on an average of Moody’s, S&P and Fitch and have a country of risk of either the U.S. or a Western European country. Qualifying preferred securities must be issued as public securities or through a 144a filing, must have a fixed or floating dividend schedule and must have a minimum amount outstanding of $100 million.
The BofA Merrill Lynch US Capital Securities US Issuers 8% Constrained Index is a subset of the BofA Merrill Lynch Corporate All Capital Securities Index that contains securities issued by U.S. corporations. The index includes investment grade, fixed rate, or fixed-to-floating rate $1,000 par securities that receive some degree of equity credit from the rating agencies or their regulators and with issuer concentration capped at a maximum of 8%.
The BofA Merrill Lynch Hybrid Preferred Securities 8% Constrained Index is a subset of the BofA Merrill Lynch Fixed Rate Preferred Securities Index that contains all subordinated constituents of the fixed rate index with a payment deferral feature and with issuer concentration capped at a maximum of 8%. The fixed rate index includes investment-grade DRD-eligible and non-DRD-eligible preferred stock and senior debt.
Risks
Under normal market conditions, the Fund invests at least 80% of the Fund’s net assets (plus the amount of any borrowings for investment purposes) in a portfolio of preferred and income-producing securities, including traditional preferred stock, trust preferred securities, hybrid securities that have characteristics of both equity and debt securities, convertible securities, contingent-capital securities, subordinated debt, senior debt and securities of other open-end, closed-end or exchange-traded funds that invest primarily in the same types of securities. The Fund may also invest up to 15% of its net assets in common stock. The portions of the Fund’s assets invested in various types of preferred, debt or equity may vary from time to time depending on market conditions. In addition, under normal market conditions, the Fund invests more than 25% of its total assets in companies principally engaged in financial services.
Some important risks of the Fund are: Preferred and Subordinated Security Risk: Preferred and other subordinated securities rank lower than bonds and other debt instruments in a company’s capital structure and therefore will be subject to greater credit risk than those debt instruments. Distributions on some types of these securities may also be skipped or deferred by issuers without causing a default. Some of these securities typically have special redemption rights that allow the issuer to redeem the security at par earlier than scheduled. Credit Risk: Credit risk is the risk that an issuer of a security will be unable or unwilling to make dividend, interest and principal payments when due and the related risk that the value of a security may decline because of concerns about the issuer’s ability to make such payments. Credit risk may be heightened because the Fund may invest in “high yield” or “high risk” securities; such securities, while generally offering higher yields than investment grade securities with similar maturities, involve greater risks, including the possibility of default or bankruptcy, and are regarded as predominantly speculative with respect to the issuer’s capacity to pay dividends and interest and repay principal. Interest Rate Risk: If interest rates rise, in particular, long-term interest rates, the prices of securities held by the Fund may fall. Concentration Risk: The Fund intends to invest 25% or more of its total assets in securities of financial services companies. This policy makes the Fund more susceptible to adverse economic or regulatory occurrences affecting financial services companies. Financial Services Company Risk: Financial services companies are especially subject to the adverse effects of economic recession, currency exchange rates, government regulation, decreases in the availability of capital, volatile interest rates, portfolio concentrations in geographic markets and in commercial and residential real estate loans, and competition from new entrants in their fields of business.
Investors should consider the investment objectives and policies, risk considerations, charges, and ongoing expenses of an investment carefully before investing. The prospectus contains this and other information relevant to an investment in the Fund. Please read the prospectus carefully before you invest or send money. To obtain a prospectus, please contact your investment representative or Destra Capital Investments LLC or download a PDF here.
Risk is inherent in all investing. The value of your investment in the Fund, as well as the amount of return you receive on your investment, may fluctuate significantly from day to day and over time. You may lose part or all of your investment in the Fund or your investment may not perform as well as other similar investments. The risks of the Fund will result from both the Fund’s direct investments and its indirect investments made through the Subsidiary. Accordingly, the risks that result from the Subsidiary’s activities will be described herein as the Fund’s risks.